← About me & projects
Stage 02 · feature engineering
Time-series features
What does one stock’s own history say?
Trend, band, momentum, volatility and volume features for AAPL from March 2020 to August 2024, charted in the shared dark theme and exported as the seven inputs the trading agent sees.
+240%AAPL, $67 → $228
62%of days above the 50-day average
2520/50-day average crossings
11% / 1%days with RSI over 70 / under 30
How it works
- Download. Daily open, high, low, close and volume for AAPL.
- Build features. Returns, 20- and 50-day moving averages, price and return volatility, Bollinger Bands, 14-day RSI and a next-day direction target, in one call.
- Chart. Candlesticks with volume, moving averages, Bollinger Bands, an indicator panel and an animated price path.
- Hand off. Save the seven features the agent uses: close, both averages, volatility, both bands and RSI.
Results
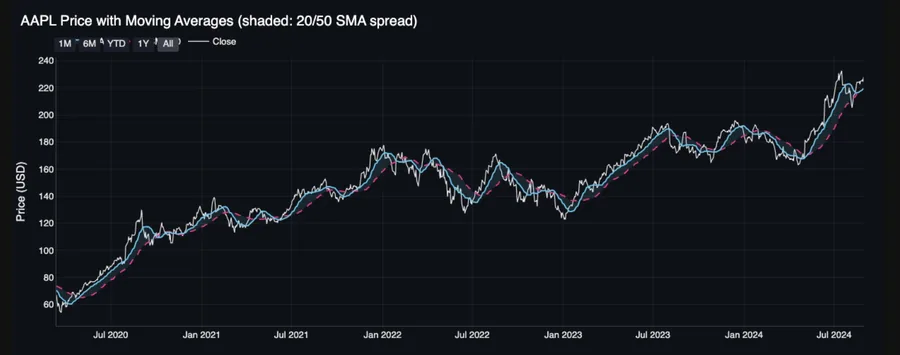
A steady uptrend with clear regimes
Close (white) with the 20-day (blue) and 50-day (pink dashed) averages; shading is the gap between them.
Wide gaps mark trends such as the 2020 rally and mid-2024 surge; tight crossings mark choppy stretches such as most of 2022.
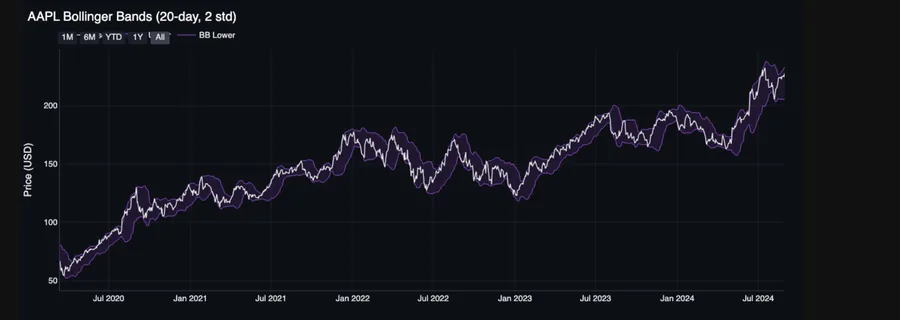
Bands that breathe with volatility
The 20-day average ± two standard deviations. The band balloons in fast markets and pinches in calm ones; closes outside it, about 1 day in 10, flag unusually strong moves.
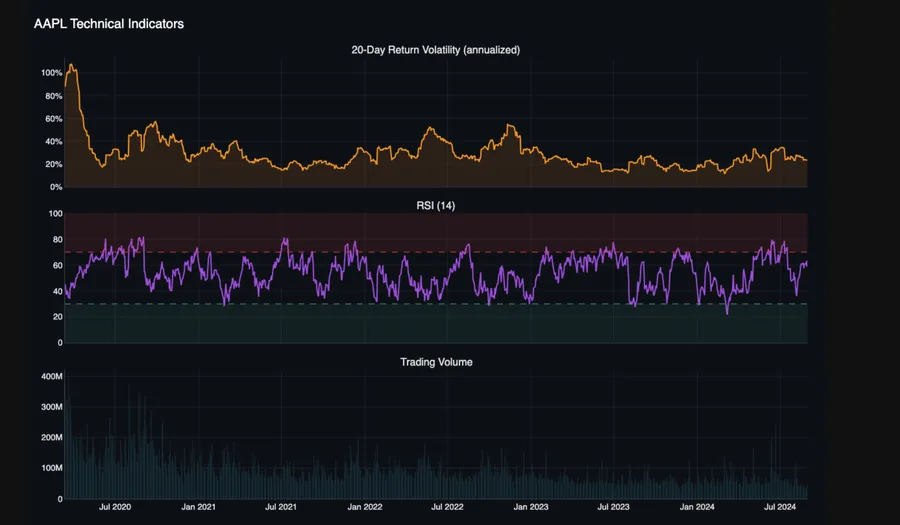
Volatility, momentum and volume
- Volatility topped 100% in the March 2020 crash, flared to about 50–55% in late 2020 and 2022, and mostly sat at 15–30% since 2023.
- RSI was overbought on 11% of days and oversold on 1%, the signature of a long uptrend.
- Volume peaked in 2020 and has mostly stayed under 100M shares a day since 2023.
How I tested this
- Data
- Daily open, high, low, close and volume for AAPL, March 2020 to August 2024.
- How the features are built
- Every indicator uses only past prices, so the exported file can feed a trading agent without look-ahead.
- What this does not show
- This stage describes one stock’s history; it makes no trading claim on its own.
Takeaways
- Features describe regimes. Trend, band width and RSI zones separate calm uptrends from choppy, volatile stretches.
- Built for the next stage. The exported seven-feature file is exactly what the DQN agent reads each day.
In the repository
View on GitHub: damion-m/Quantitative-Strategies
time_series.ipynbAAPL_time_series_features.csvAAPL_trading_features.csv